
The Pig Single Cell RNA Atlas (PCA) database is created to facilitate the application of pigs in biomedical research and applications. Pigs have been used as large animals for modelling human diseases, testing and development of treatments. Recently, there are growing interests in using genetically modified pigs for human organ transplantation. And breakthroughs in kidney and heart transplantation have been achieved. However, it is yet to fully understand the cellular compositions and similarity between pig and human organs. Other remaining challenges such as chronic immune rejections are still the major challenges to be overcome. The PCA is thus created as a fully open access resource to facilitate the understanding of cell and organ functions in pigs using single cell RNA sequencing.
In the new release PCA v.2023.1, new single nuclei RNA sequencing data from PigGTEx project in incorporated. Tissue markers and cell type markers are updated based on new integrated data in our PCA new release.
In the new release PCA v.2022.2, new features have been added to the database. Search of top 50 markers for each tissue and single cell type is included. New single cell RNA sequencing data from a study of pig Ileum development is incorporated in our PCA new release.
In the previous release of PCA (v.2022.1), we have performed single cell and single nucleic RNA sequencing of 20 tissues (from 10 major organs). The composition of cell types within tissues/organs is annotated according to the expression of cell type-specific markers. An interactive database is created, allowing free exploration of cell type specific gene expression, co-expression analysis, generation of various gene expression plots, and analysis of tissue and cell type specific gene expression.
The PCA consortium will bi-annually update the database through the integration of both published single cell RNA sequencing datasets and datasets generated by PCA.
Please cite the PCA as:
Fei Wang, Peiwen Ding, Xue Liang, Xiangning Ding, Camilla Blunk Brandt,Evelina Sjostedt, Jiacheng Zhu, Saga Bolund, Lijing Zhang, Laura P. M. H. de Rooij, Lihua Luo, Yanan Wei, Wandong Zhao, Zhiyuan Lv, Janos Hasko, Runchu Li, Qiuyu Qin, Yi Jia, Wendi Wu, Yuting Yuan, Mingyi Pu, Haoyu Wang, Aiping Wu, Lin Xie, Ping Liu, Fang Chen, Jacqueline Herold, Joanna Kalucka, Max Karlsson, Xiuqing Zhang, Rikke Bek Helmig, Linn Fagerberg, Cecilia Lindskog, Fredrik Ponten, Mathias Uhlen, Lars Bolund, Niels Jessen, Hui Jiang, Xun Xu, Huanming Yang, Peter Carmeliet, Jan Mulder, Dongsheng Chen, Lin Lin, Yonglun Luo. Nature Communications volume 13, Article number: 3620 (2022)
Contact:
Yonglun Luo (Alun), Ph.D., Associate Professor
Group leader, Department of Biomedicine, Aarhus University
The Lars Bolund Institute of Regenerative Medicine, BGI-Qingdao
Chair of the Pig Cell Atlas (PCA) consortium
Email: alun@biomed.au.dk
Address: Building 1116-152, Hoegh-Guldbergs Gade 10, 8000 Aarhus
Tissue Marker Search
Cell Type Marker Search
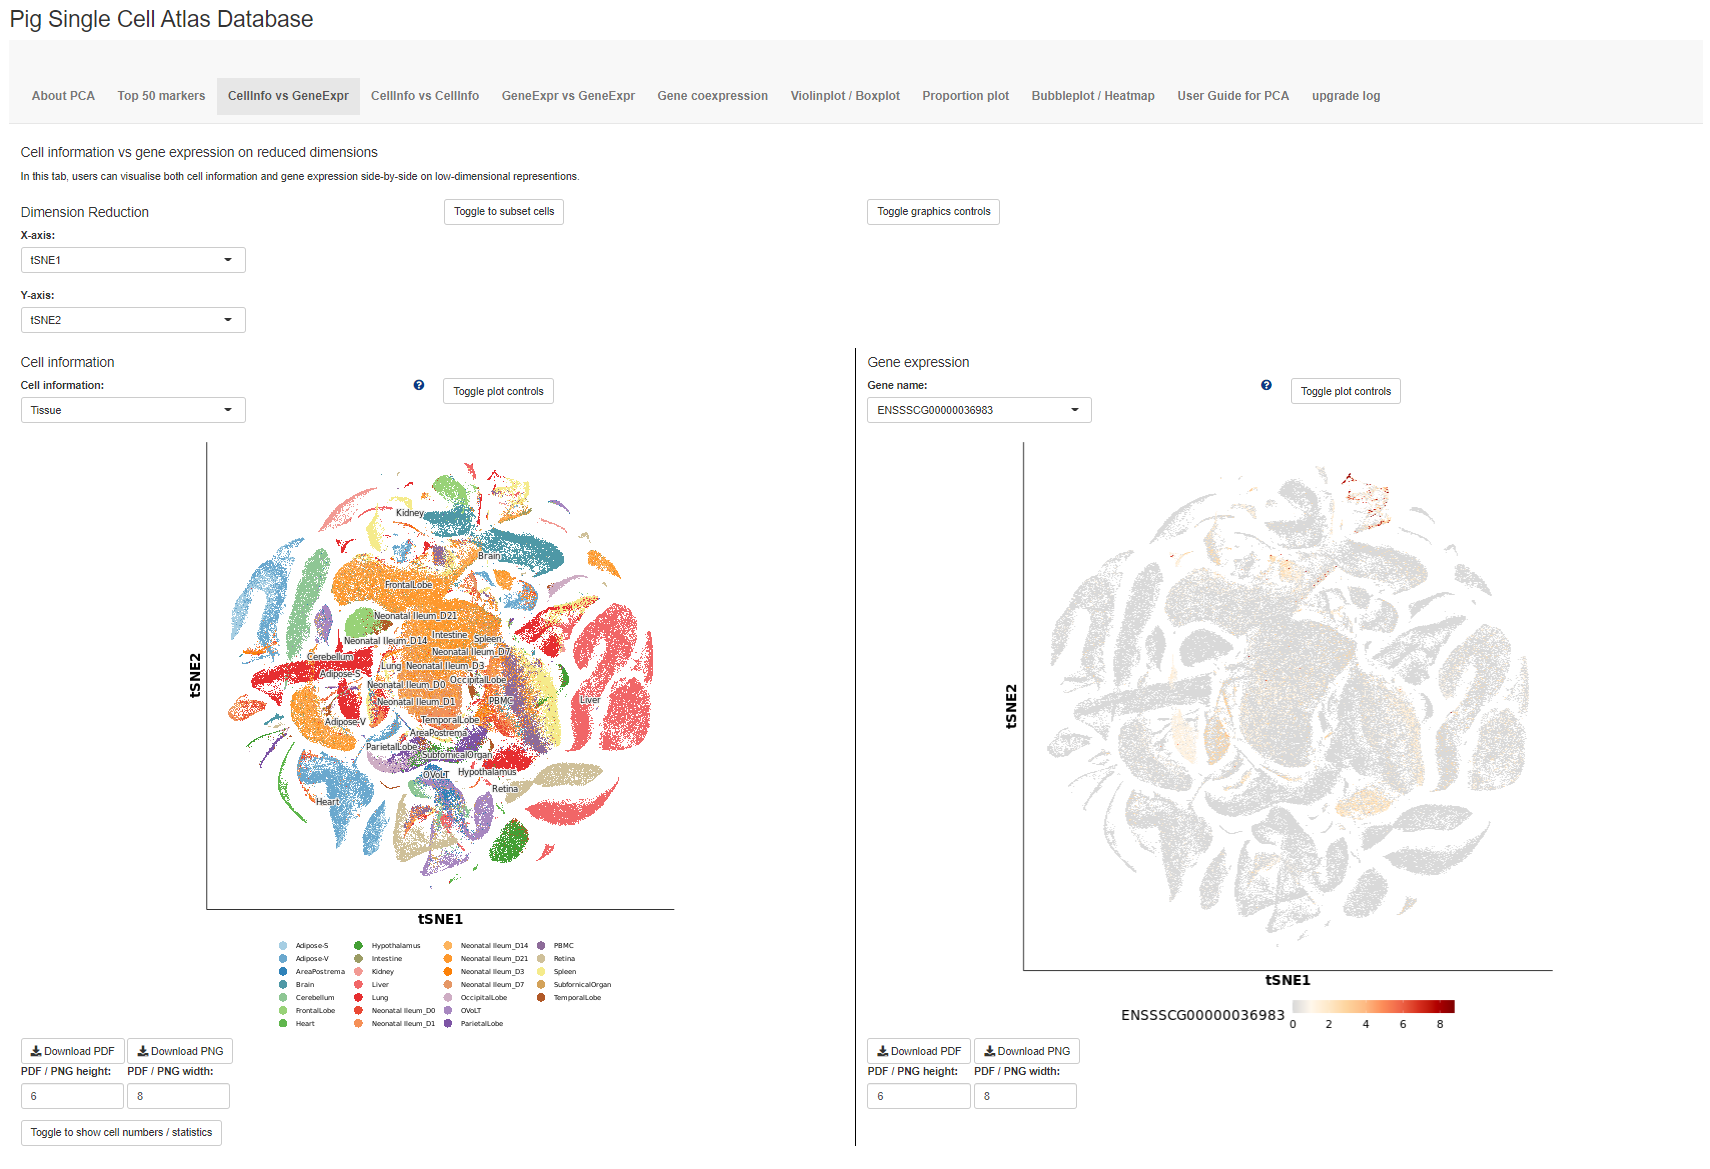
Cell information vs gene expression on reduced dimensions
In this tab, users can visualise both cell information and gene expression side-by-side on low-dimensional representions.Dimension Reduction
Cell information vs cell information on dimension reduction
In this tab, users can visualise two cell informations side-by-side on low-dimensional representions.Dimension Reduction
Gene expression vs gene expression on dimension reduction
In this tab, users can visualise two gene expressions side-by-side on low-dimensional representions.Dimension Reduction
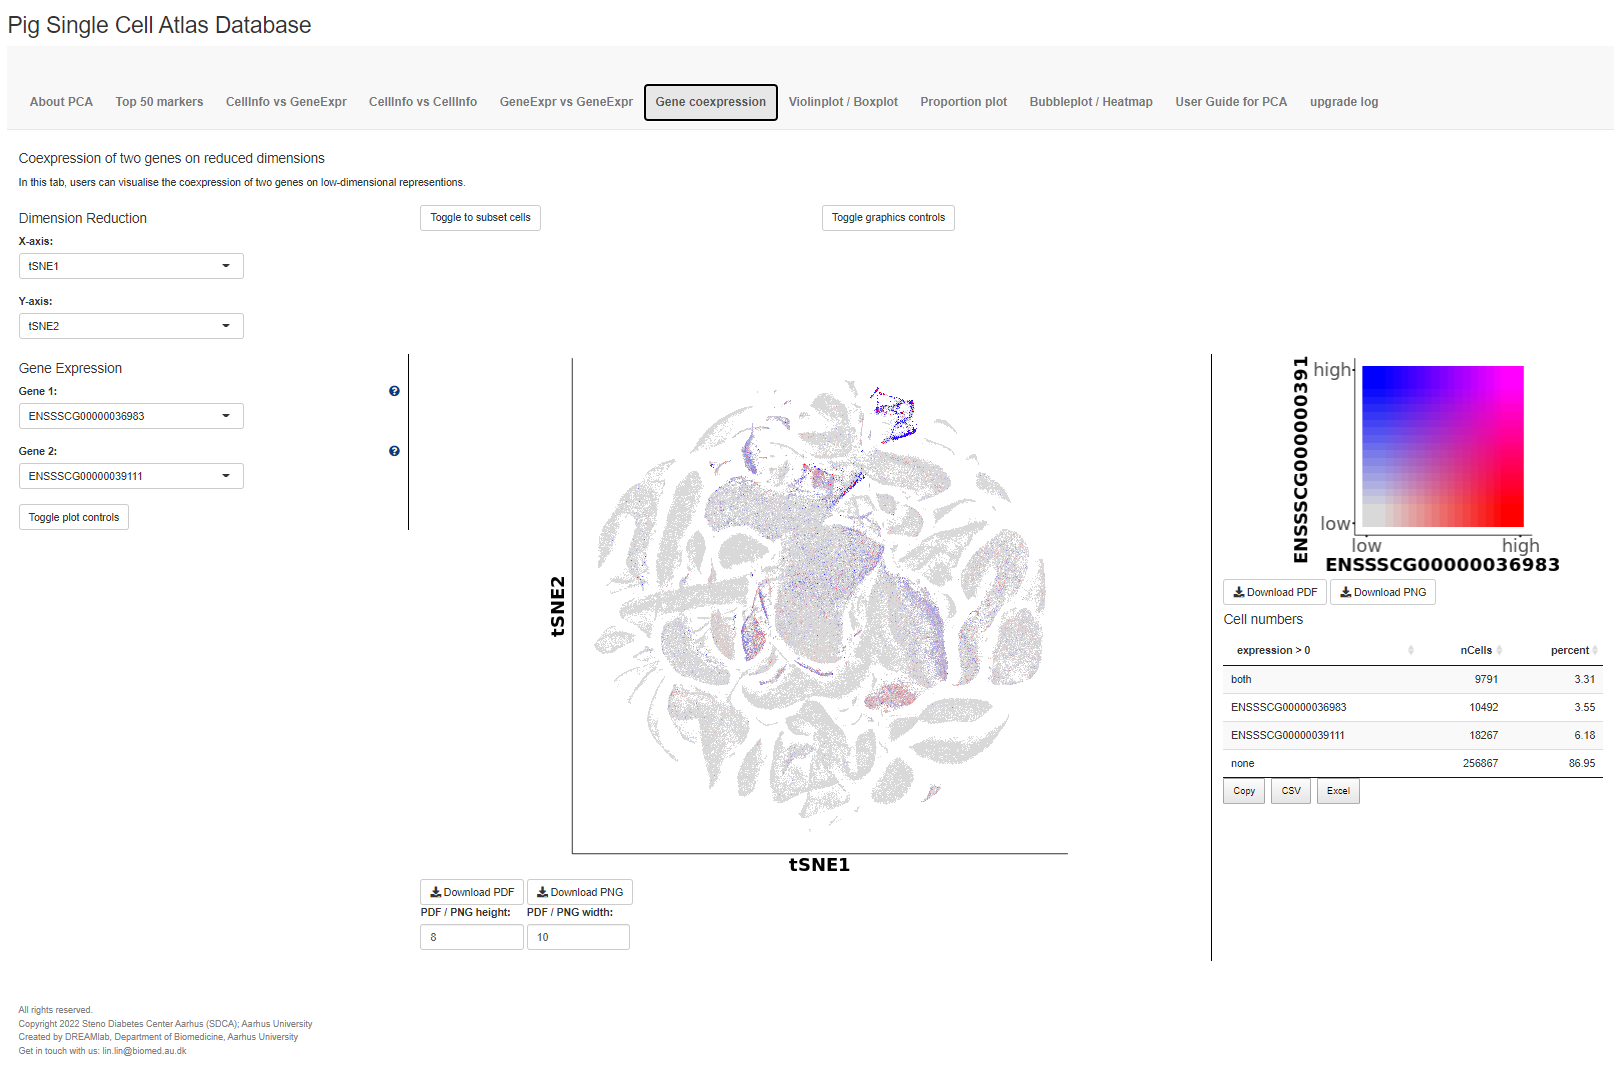
Coexpression of two genes on reduced dimensions
In this tab, users can visualise the coexpression of two genes on low-dimensional representions.Dimension Reduction
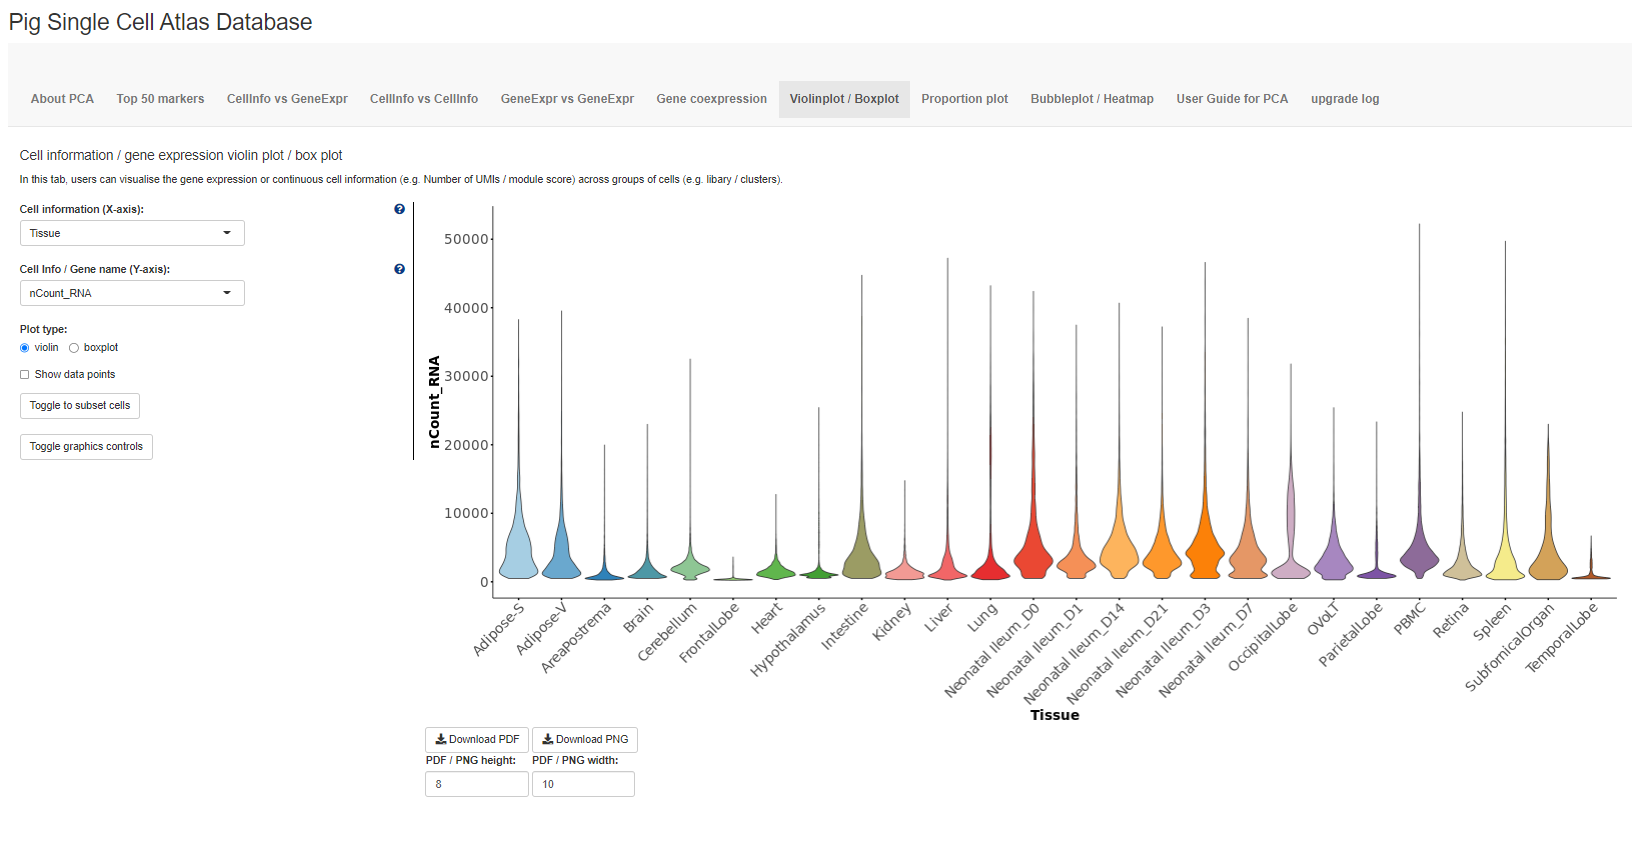
Cell information / gene expression violin plot / box plot
In this tab, users can visualise the gene expression or continuous cell information (e.g. Number of UMIs / module score) across groups of cells (e.g. libary / clusters).Proportion / cell numbers across different cell information
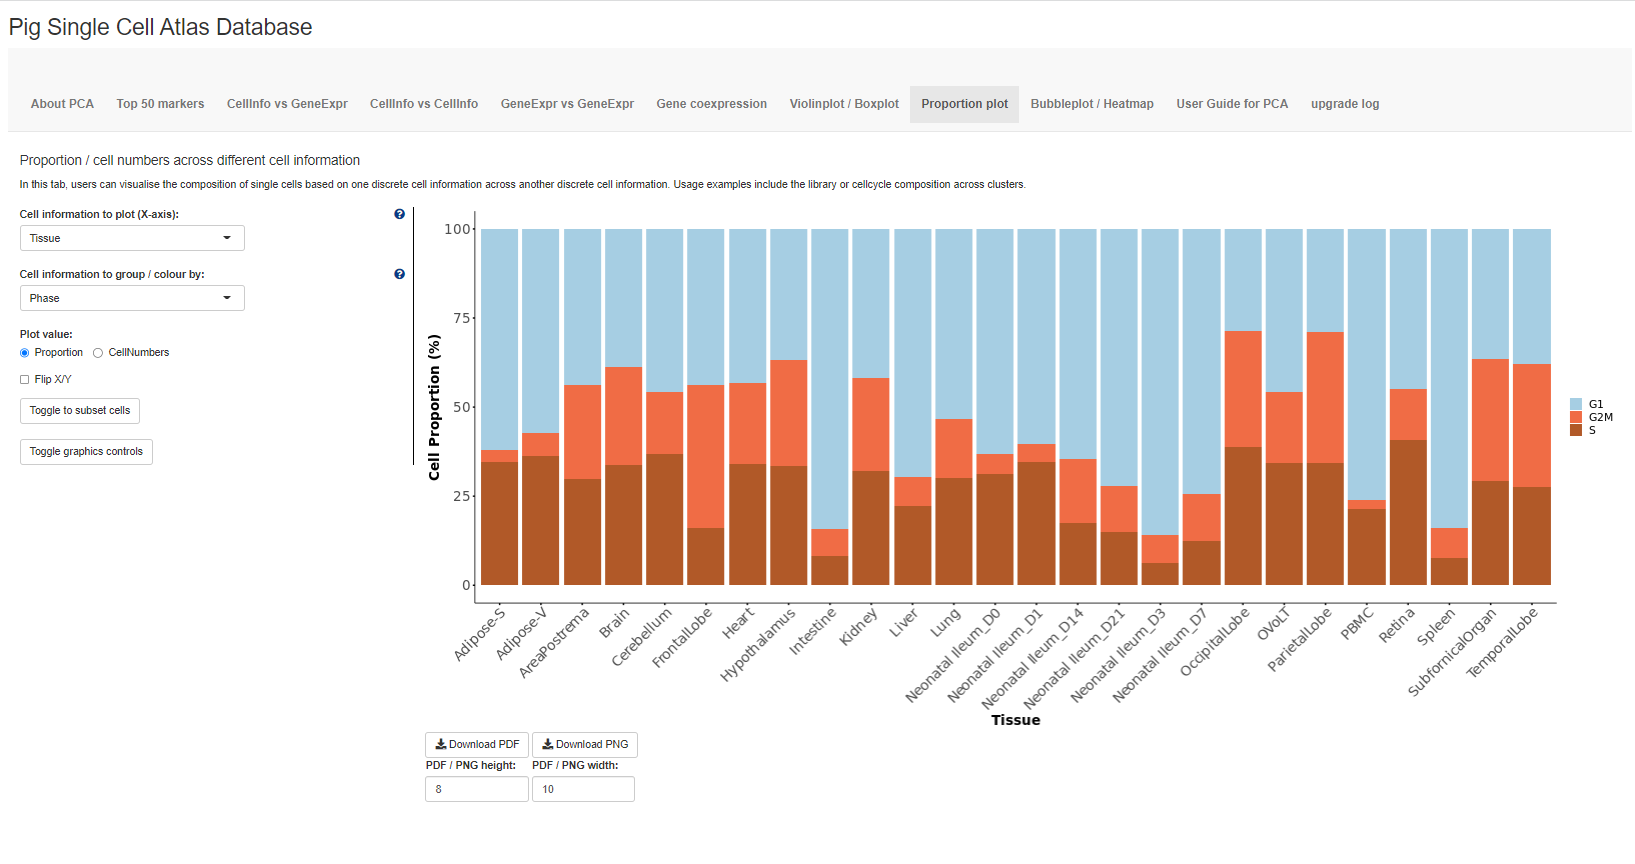
In this tab, users can visualise the composition of single cells based on one discrete cell information across another discrete cell information. Usage examples include the library or cellcycle composition across clusters.Gene expression bubbleplot / heatmap
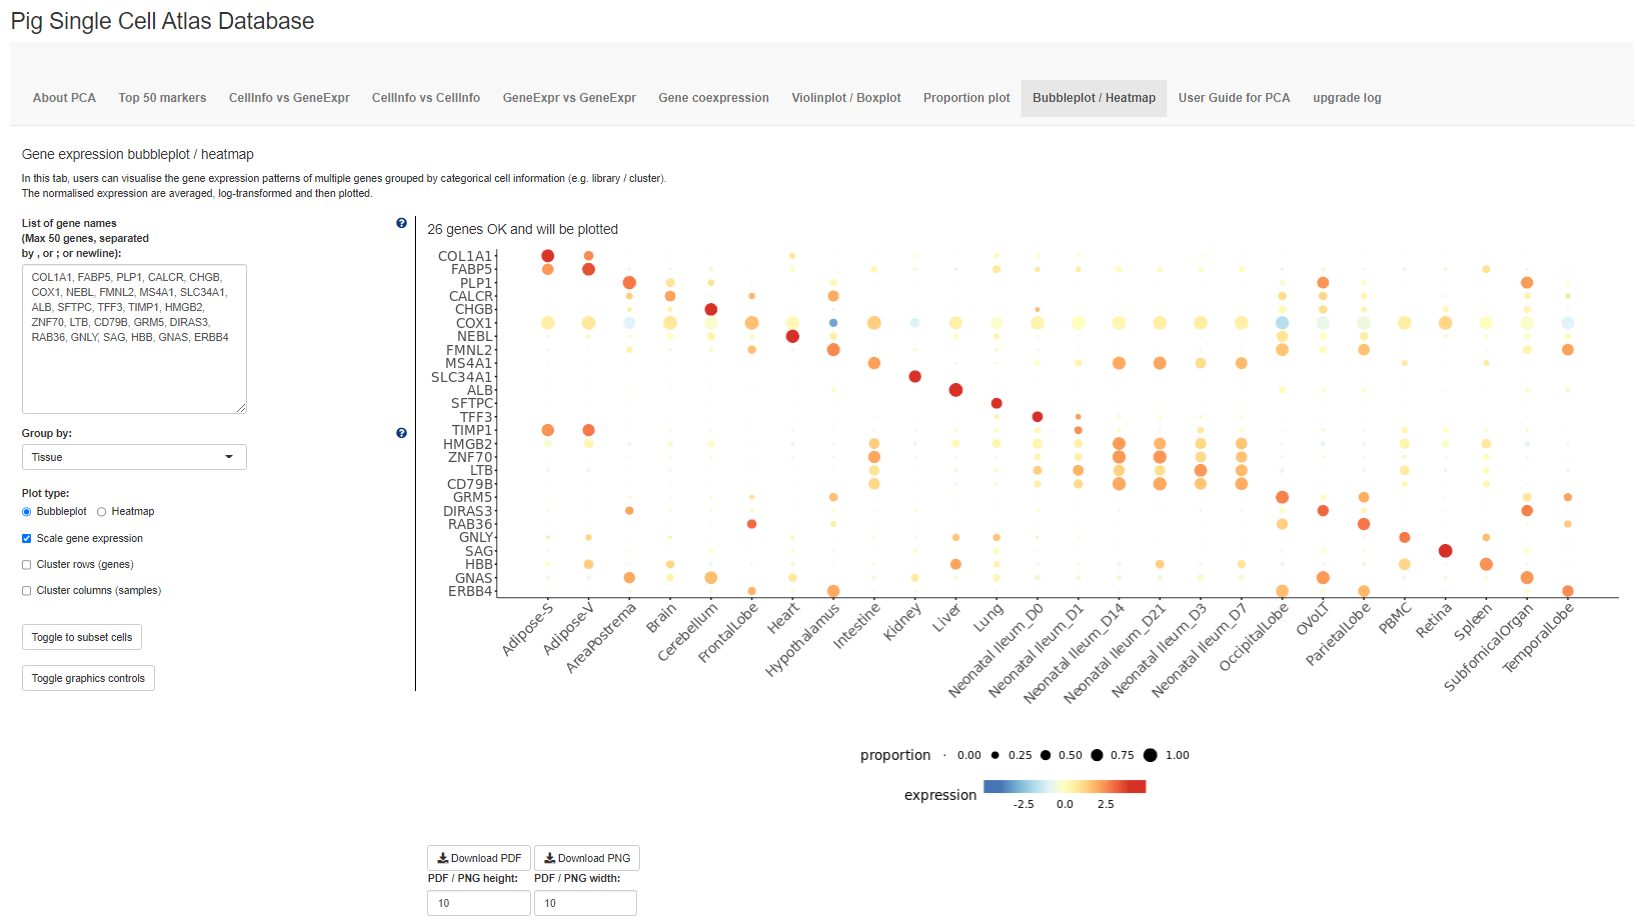
In this tab, users can visualise the gene expression patterns of multiple genes grouped by categorical cell information (e.g. library / cluster).The normalised expression are averaged, log-transformed and then plotted.
The database mainly contains seven tabs (in grey panel), with the opening page showing the first tab CellInfo vs GeneExpr (see below), plotting both cell information and gene expression side-by-side on reduced dimensions e.g. TSNE. Users can click on the toggle on the bottom left corner to display the cell numbers in each cluster / group and the number of cells expressing a gene. The next two tabs are similar, showing either two cell information side-by-side (second tab: CellInfo vs CellInfo) or two gene expressions side-by-side (third tab: GeneExpr vs GeneExpr).
The fourth tab Gene coexpression blends the gene expression of two genes, given by two different colour hues, onto the same reduced dimensions plot. Furthermore, the number of cells expressing either or both genes are given.
The fifth tab Violinplot-Boxplot plots the distribution of continuous cell information e.g. nUMI or module scores or gene expression across each cluster / group using violin plots or box plots.
The sixth tab Proportion plot plots the composition of different clusters/groups of cells using proportion plots. Users can also plot the cell numbers instead of proportions.
The seventh tab Bubbleplot / Heatmap allows users to visualise the expression of multiple genes across each cluster / group using bubbleplots / heatmap. The genes (rows) and groups (columns) can be furthered clustered using hierarchical clustering.
2023.06.12: add scRNAseq data from PigGTEx project; tissue markers and cell type markers are updated accordingly (link will be updated soon)
2023.03.23: add rds file downlod link
2022.10.14: add function for searching top 50 markers for tissues and cell types; add scRNAseq data from Ileum development
All rights reserved.
Copyright 2022 Steno Diabetes Center Aarhus (SDCA); Aarhus University
Created by DREAMlab, Department of Biomedicine, Aarhus University
Get in touch with us: lin.lin@biomed.au.dk
This database is created with ShinyCell